Uncover hidden insights and optimise team training with the PlayerData app, your one-stop shop for athlete performance data. The PlayerData app takes raw performance data and turns it into actionable insights, helping you take your team's performance to the next level.
The PlayerData app features five intuitive tabs, working seamlessly together to unlock a comprehensive picture of your athletes' performance:
- Highlights
- Progress
- Matches
- Training
- Analyse
All of these sections of the PlayerData app work in tandem, enabling you to utilise your data to improve athlete performance and team success. In this blog, we'll dive into these five core aspects, outlining how to navigate them and highlighting their importance. Please note that you need to record data and sync to your PlayerData app before following this guide on your own phone or tablet.
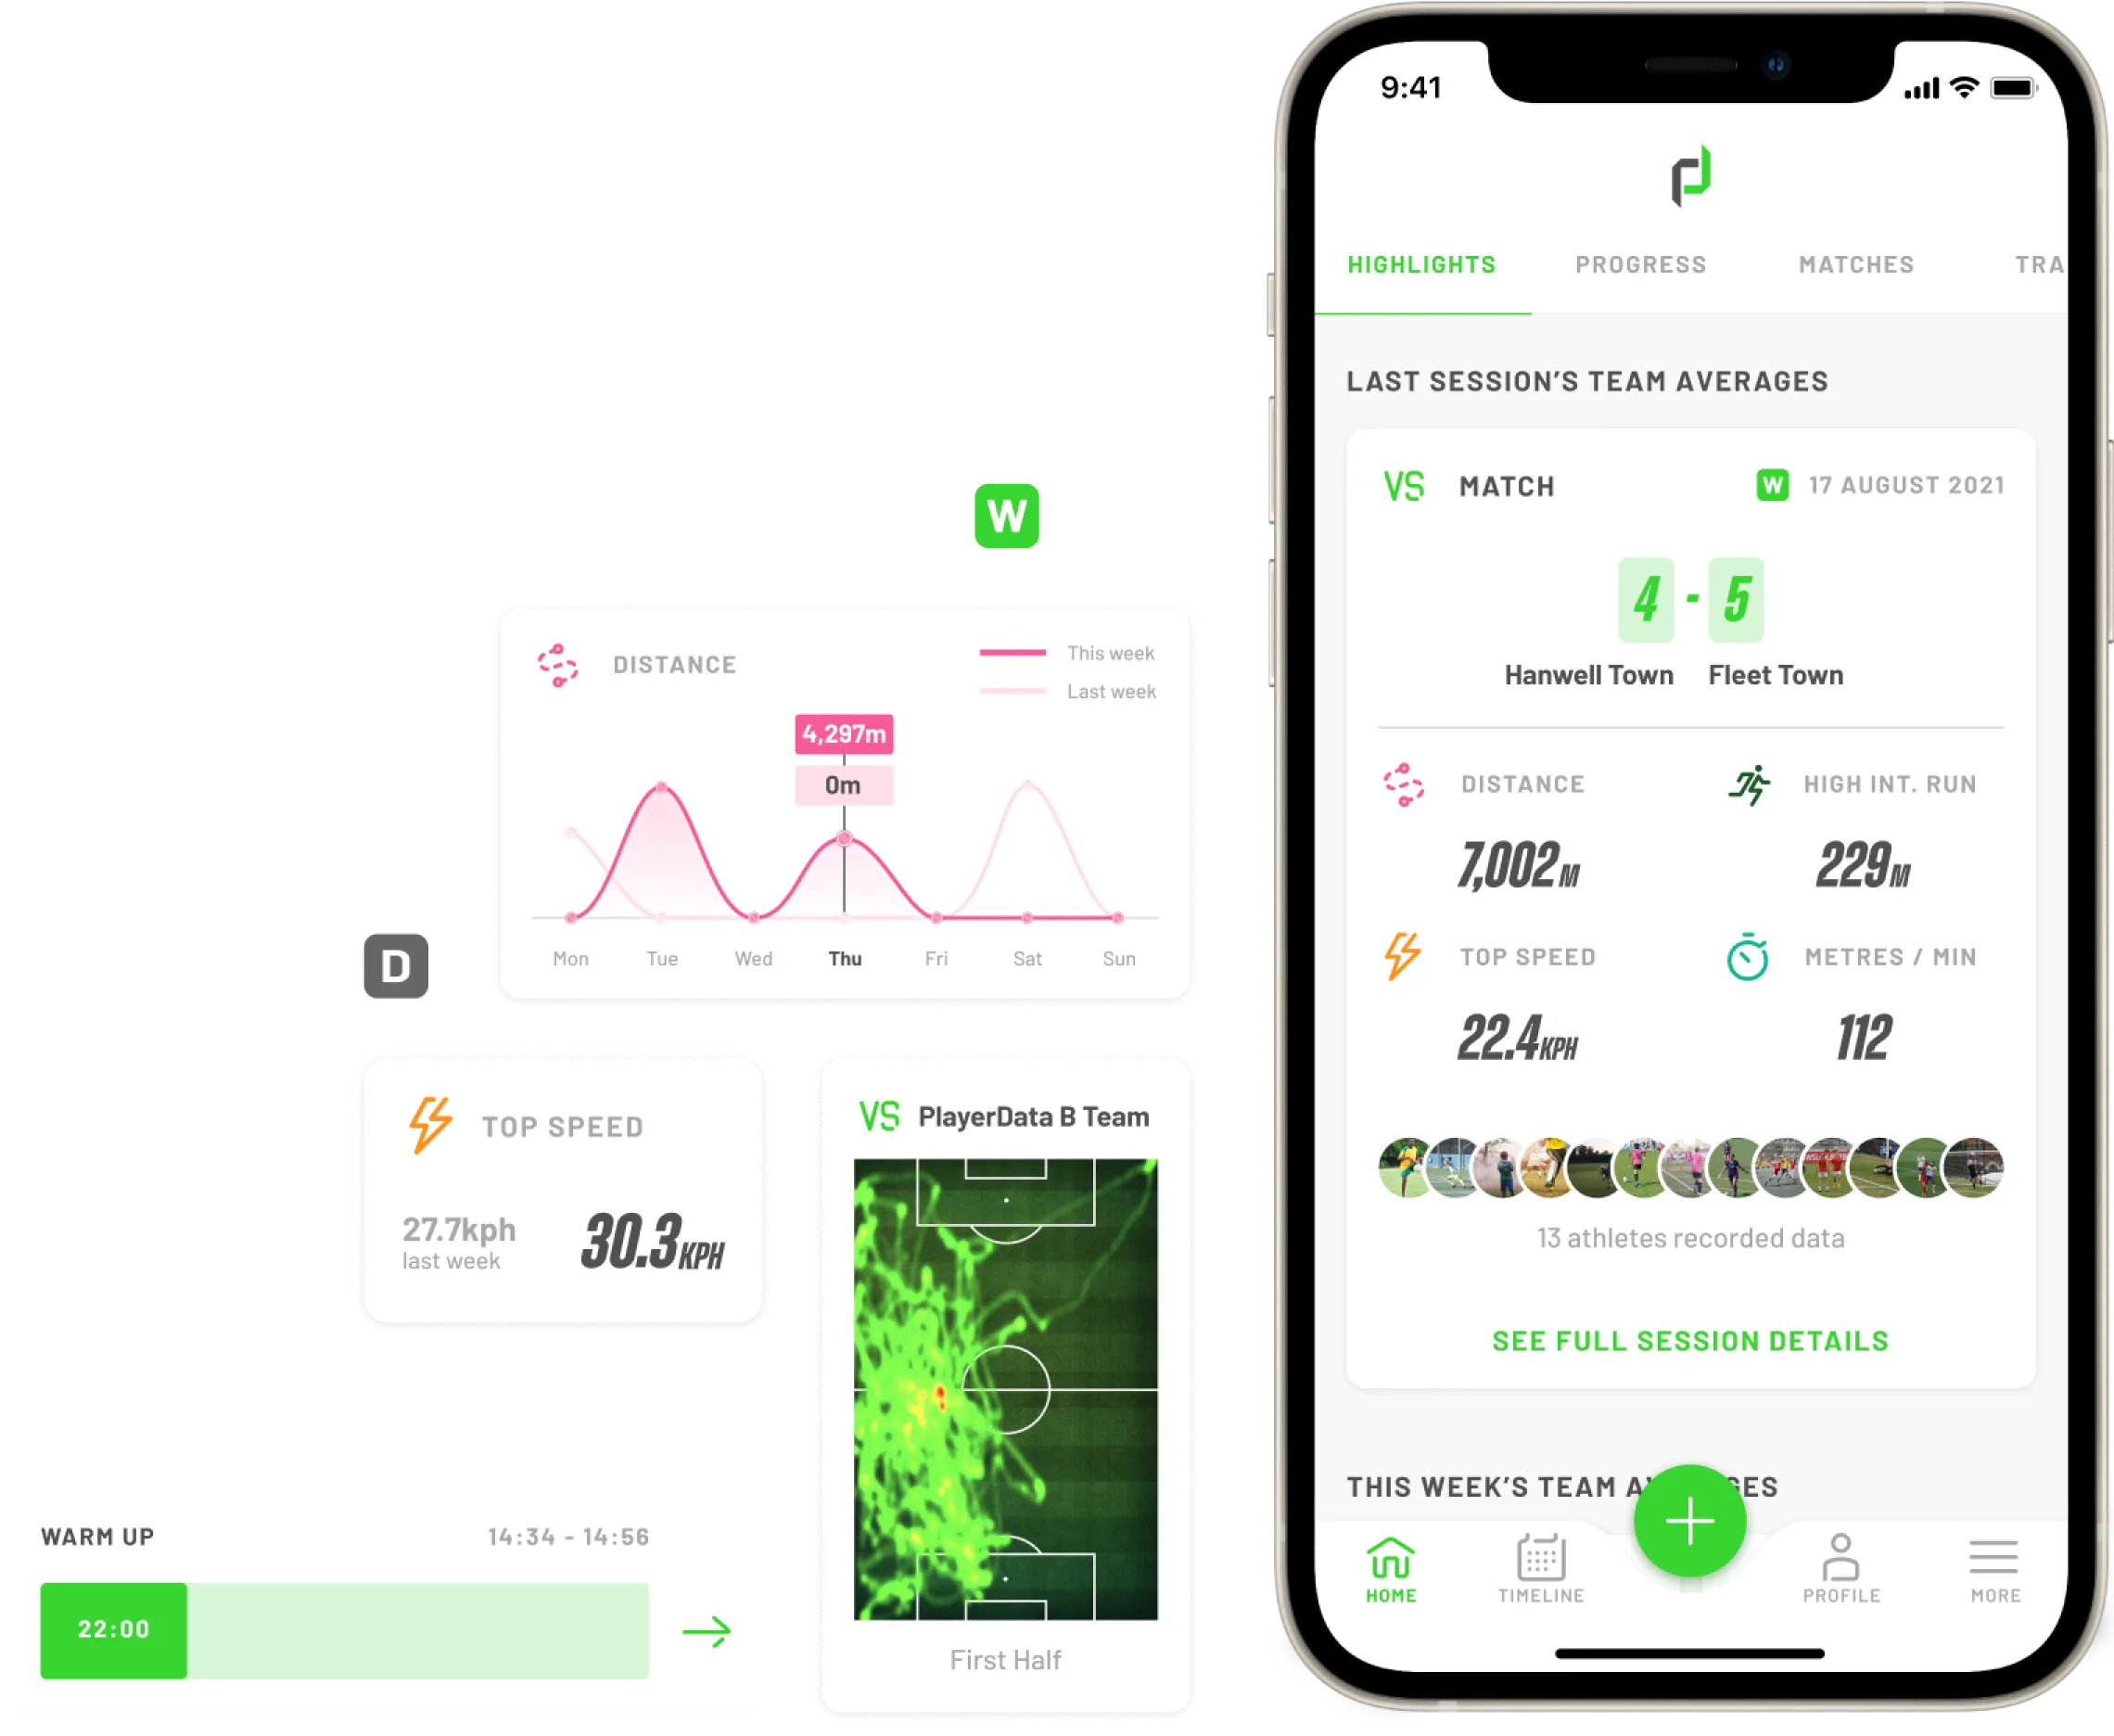
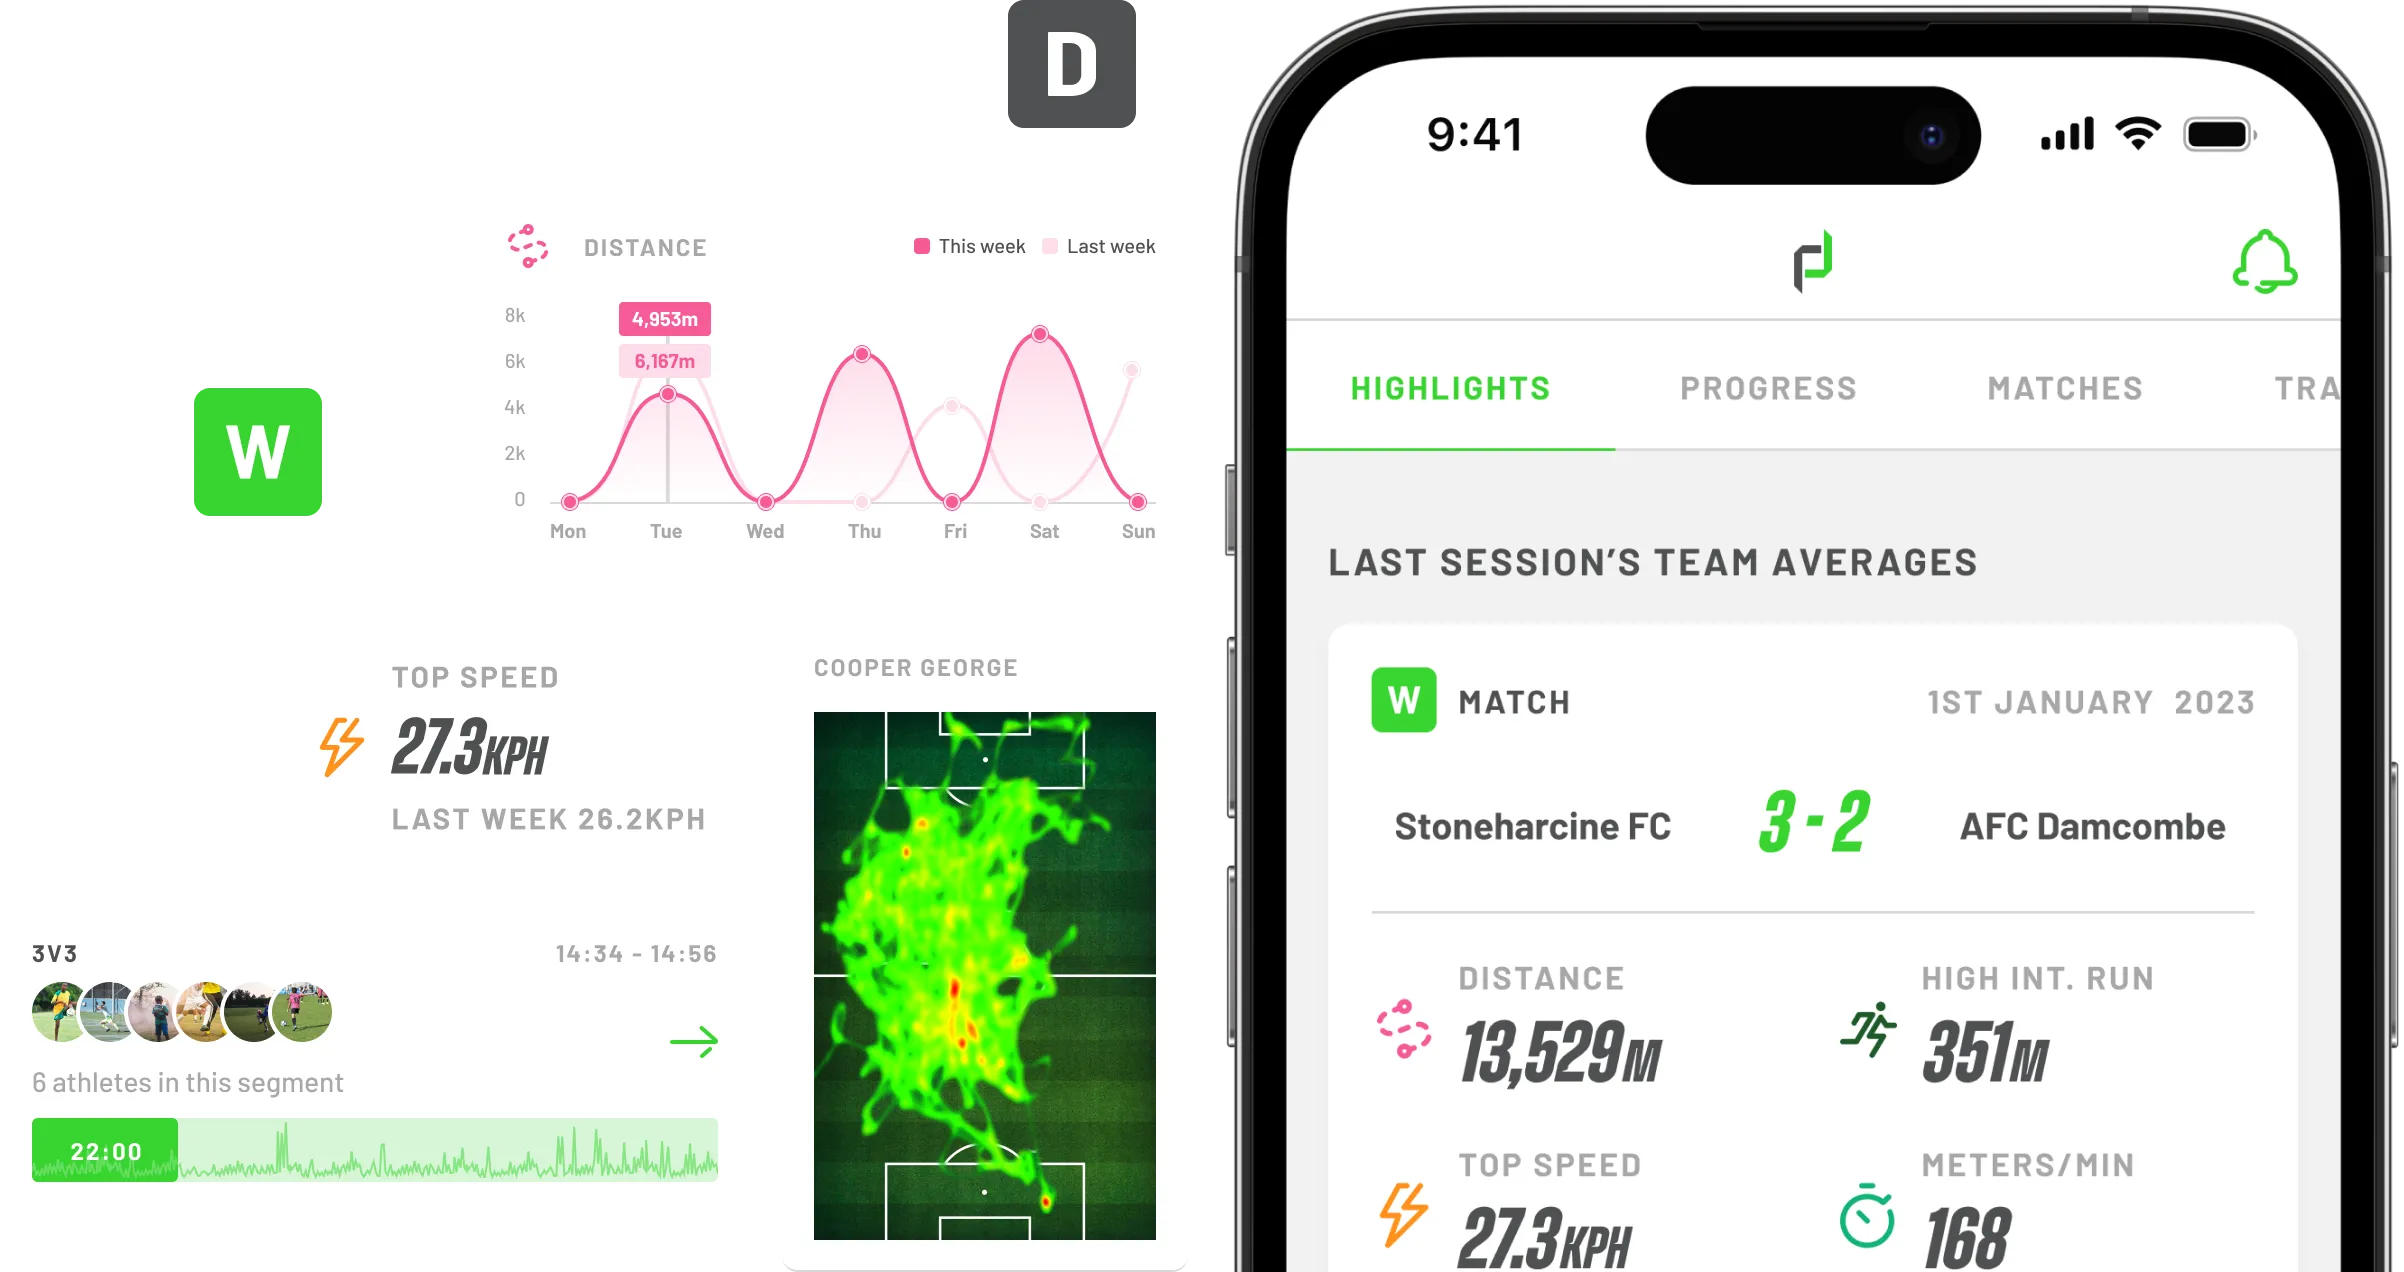
Highlights
The ‘Highlights’ tab provides an overview of your data values for the current week across all athletes. This provides insight into how the team is performing and is typically used at the end of the week to evaluate performance for that 7–day period. However, this section can be used during the week to see how the data is progressing.
How do I navigate this feature?
This section is broken down into 4 key tabs, you can navigate all the tabs by simply scrolling in the app and they can be viewed individually, if desired. These tabs have been listed below along with a definition.
Last Session’s Team Averages: A snapshot of your last session averages across four key metrics: distance, high–intensity running, top speed and metres/min. This acts as a shortcut to see your full session breakdown.
This Week’s Team Averages: A snapshot of your team averages across four key metrics: distance, high–intensity running, top speed, and metres/min.
Top Performers This Week: This section shows your top performers for the current week for total distance and top speed. In addition, the app will also display a ‘Leaderboard’ where you can look at an overview of all the athletes for that week and you can toggle the desired variable.
Why are these snapshots important?
These snapshots allow an accurate oversight of physical performance across all athletes for a given period. This allows the coaches an insight into who is performing above and below the group’s standard and gives the practitioners a view of how the athletes are responding to the training. In addition, this feature gives you immediate feedback on individual performance and can provide key context to information from a session. For example, if a large group of athletes are complaining of fatigue, you can immediately see if the last session averages were high or low.
Progress
The 'Progress' tab provides an overview of the average daily value for your data metrics, comparing the current week to the previous across several key metrics. This provides a different perspective on physical performance, allowing coaches and practitioners a view into how their team is performing on a weekly basis instead of per session.
How do I navigate this feature?
This feature is viewed through 9 tables under the ‘Stat Breakdown’ section, all of which display their respective average metric values for the current and previous week. The specific display for each table can be altered through the ‘Showing’ tab, this allows you to change the display. For example, using this tab you can set the tables only to show certain positional groups, individual athletes, or custom groups.
Why is this feature important?
Having a comparative outlook of the data offers insight into how the weekly load is distributed across volume (distance), intensity (high–intensity runs and sprint distance), and density (accelerations and decelerations) metric values. This can be used to structure training sessions to allow peak performance on a match day, this concept is referred to as periodisation. In addition, examining the workload from the current week to the last can highlight improvement in performance. In contrast, comparison can highlight a reduction in workload which can indicate a rise in fatigue levels. Workload management is crucial as it is viewed as a key driver towards and away from injury sustainment.
Matches
The ‘Matches’ tab provides quick access to the last six match sessions and a quick view of the results at the top. This tab provides a graphic for the team average for the filtered metric over the last six sessions to identify if there have been increases or decreases.
How do I navigate this feature?
To access this feature, simply use the top scroll bar to find the 'Matches' tab. You’ll see a page displaying the results of the six most recent games, along with a result board. To reveal more, click the arrow on each match tab to reveal additional information, and for quick access to a specific match, click 'see full match details'.
Why is this feature important?
This feature enables the coach to promptly review the outcomes of the last six matches, facilitating a quick comparison with previous sessions. By providing an overview of the team's performance, it aids in decision–making processes. Additionally, the ability to access specific match data enhances the review options, aiding in effective comparison analysis.

Training
The ‘Training’ tab provides a quick access view of the last six training sessions. This tab provides a graphic for the team average for the filtered metric over the last six sessions to identify if there have been increases or decreases.
How do I navigate this feature?
To navigate this feature use the top scroll bar to reach the 'Training' tab. From here you will see a graphic that you can filter to view the team average for different metrics over the last six sessions. You can also quickly navigate to the previous six training sessions by selecting the session you wish to look at and clicking 'see full session details'.
Why is this feature important?
This feature is crucial to quickly viewing the loading of players, especially in the lead–up to a match. This will assist coaches in tailoring their sessions so that players can reach their optimum performance level, and help to prevent their players from burning out.
Analyse
Session Reports provide concise visual analysis of session data, automatically delivered as PDF and CSV files via email. Team averages and key metrics like total distance covered, high–intensity running, and top speed are readily available. The report also includes average player positions for both halves, alongside individual athlete results.
How do I navigate this feature?
Open the app, use the top bar and scroll along to the ‘Analyse’ tab. This page opens up a variety of report types to use depending on what you are needing at the time. You can choose between:
Summary Report: This displays an athlete's total workload over a chosen date range, aiding in future session planning.
Session Report: Provides a detailed analysis of a single session for the entire team, facilitating comparison of metrics across all athletes. This can be for training or matches.
Session Summary Report: Offers multi–session analysis, comparing the teams total metrics across multiple sessions.
Athlete Comparison: Enables a direct head-to-head comparison between two athletes.
The app collects and stores all reports generated and compiles them in the ‘report history’ tab at the top of this screen.
Why is this feature important?
This feature is crucial for objective performance assessment, allowing coaches to track improvements in fitness and speed over time. It facilitates comparisons between players in similar positions, aiding in identifying disparities and potential issues such as injuries or lack of effort.
Further information and insights on the practical application of session reports can be found here: Session Reports.
Conclusion
These snapshot tabs are a fantastic time-saver for coaches, however PlayerData is more than a powerful app. PlayerData is a comprehensive performance management system designed to empower coaches and athletes at all levels. By providing elite level data tracking, clear data visualisations, insightful reports, and expert support from our sports scientists, PlayerData equips you with the tools and knowledge to unlock your team's true potential. Take control, optimise training, and achieve peak performance with PlayerData. If you aren't already a member of our growing PlayerData Community, get in touch today to see the difference data-driven insights can make for your team.